Intro:
This week UBS updated their clients with two timely reports, one each for gold and silver. Below is our breakdown of those reports, but first a summary of what you are about to read:
UBS argues gold’s sharp selloff reflects volatility inside a continuing bull market, supported by unresolved policy credibility risks, expected rate cuts, and strong official demand. Silver, by contrast, is undergoing a violent risk repricing, driven by extreme volatility, concentrated positioning, and industrial demand sensitivity, leaving the metal unattractive until prices adjust further to compensate for risk.
GOLD: Not the End: Gold’s Sharp Drawdown in Historical Context
Price Shock and Immediate Market Reaction
Gold experienced its steepest one day decline in more than a decade following the announcement that President Donald Trump nominated Kevin Warsh as his preferred candidate for Federal Reserve chair. Prices fell as much as 12 percent intraday before closing approximately 8.5 percent lower, marking the largest single session drawdown in 13 years.
Despite the magnitude of the move, gold remains up roughly 13 percent year to date. The bank emphasizes that volatility of this scale is historically common around perceived shifts in Federal Reserve policy expectations.
“Gold fell as much as 12% on Friday but ultimately closed about 8.5% lower, after President Donald Trump announced Kevin Warsh as his nominee for Federal Reserve chair.”
Interpreting the Selloff
The bank attributes the selloff to a combination of factors rather than a single catalyst. These include profit taking following strong gains, reduced liquidity in futures markets, margin related selling pressure, and renewed discussion around interest rate risks and US dollar strength.
Concerns intensified following Warsh’s nomination due to his public stance favoring tighter monetary discipline, balance sheet restraint, and institutional reform at the Federal Reserve. This prompted renewed debate around whether the move represented a turning point for gold’s broader bull market.
The bank argues that history suggests gold bull markets do not end simply due to price excess or declining fear. Instead, they tend to conclude when central banks re establish credibility through a sustained policy regime shift.
“Gold bull markets typically don’t conclude simply because fears diminish or prices become too high. They end when central banks establish their credibility and pivot to a new monetary policy regime.”
Historical Framework for Gold Bull Markets
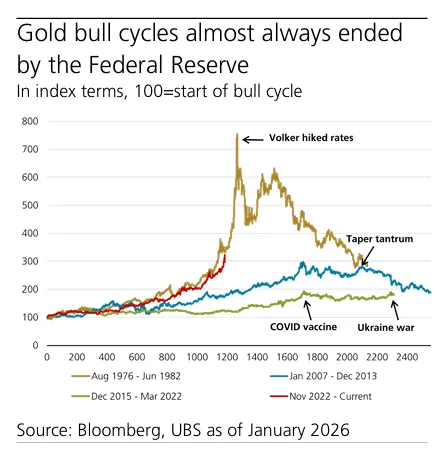
UBS frames the current episode within prior gold cycles, highlighting that major regime shifts have historically coincided with bull market endings.
Examples cited by the bank include:
- 1980: The gold bull market ended following Paul Volcker’s aggressive monetary tightening, which restored Federal Reserve credibility, drove real rates sharply higher, and strengthened the US dollar.
- 2013: Gold peaked after the Federal Reserve convinced markets it could unwind quantitative easing without destabilizing the economy, leading to rising real yields and declining inflation expectations.
By contrast, sharp drawdowns occurring mid cycle have historically resolved once underlying structural drivers reasserted themselves.
“Throughout past price cycles, gold prices tended to rise when investors doubted policymakers’ ability to preserve the dollar’s real value, and only ended once confidence fully returned.”
Current Cycle Assessment
UBS assesses the current environment as mid to late stage within an ongoing gold bull market. The bank highlights that the typical ingredients required to end a gold cycle have not yet emerged. These include persistently high real interest rates, a structurally strong dollar, geopolitical stabilization, and restored central bank credibility.
While Warsh’s nomination initially appeared hawkish, the bank notes that Fed funds pricing continues to imply further easing rather than tightening. Markets are currently pricing approximately 53 basis points of rate cuts through the end of 2026, consistent with UBS expectations for two additional cuts this year.
“We do not believe a Volcker style tightening is likely, particularly given the need for consensus within the Federal Reserve and the recent cessation of quantitative tightening.”
Portfolio Implications
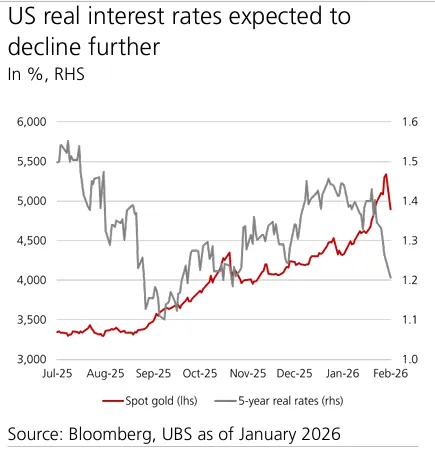
UBS views the recent drawdown as volatility within a continuing structural uptrend rather than a signal of cycle termination. Short term consolidation is expected due to higher margin requirements and liquidity constraints, with prices likely to range between USD 4,500 and USD 4,800 per ounce in the near term.
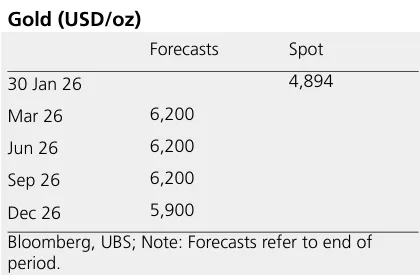
The bank reiterates its constructive medium term outlook, pointing to strong central bank demand, ETF inflows, and persistent geopolitical uncertainty. UBS recently raised its mid year forecast to USD 6,200 per ounce and continues to rate gold as Attractive within global asset allocation.
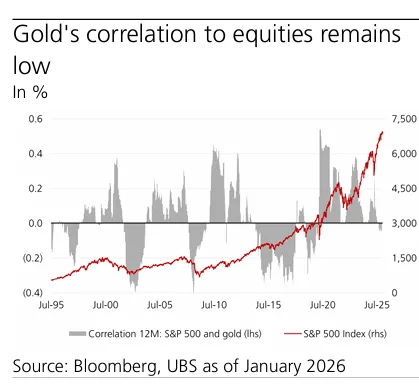
“We view gold as a strategic hedge rather than a momentum driven asset, with a mid single digit allocation appropriate for investors with an affinity for the metal.”
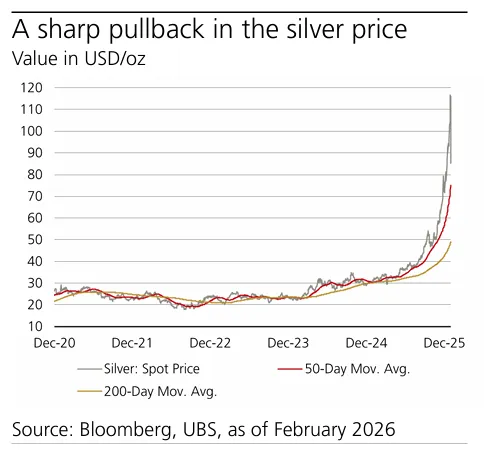
SILVER: Historical Sell Off–Volatility Forces a Repricing of Silver Risk
A Selloff Without Modern Precedent
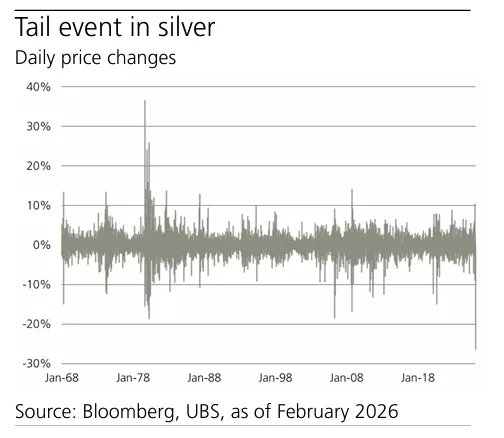
Silver experienced an extraordinary repricing on 30 January, falling 26 percent on the day with intraday drawdowns approaching 38 percent from the highs. According to the bank, such price behavior has not been observed in nearly fifty years.
The magnitude of the move places silver at the extreme end of historical volatility events, forcing both speculative and institutional participants to reassess risk exposure.
“Silver sold off by an unprecedented magnitude of 26%, with intraday pullbacks reaching nearly 38%. Such moves have not been seen in almost half a century.”
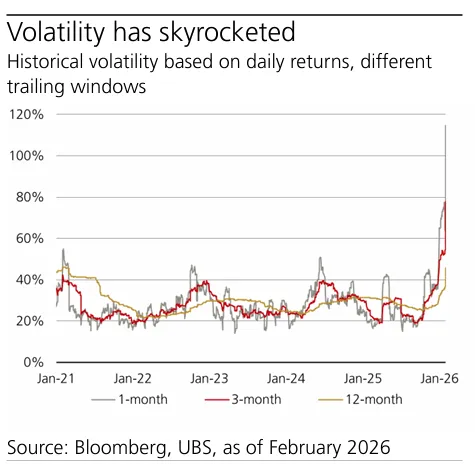
Volatility as the Central Variable
Leading into the selloff, silver had already entered an unstable regime. Daily price swings regularly reached high single digit to mid teen percentages, while intraday ranges expanded further. Prior to the collapse, one and three month historical volatility measured approximately 55 percent. These measures have since surged to roughly 115 percent and 78 percent respectively.
Margin requirements were raised by CME Group last week in response to these conditions, exacerbating forced deleveraging among futures participants.
“An asset exhibiting 60 to 120 percent volatility requires expected returns of 30 to 60 percent to justify long exposure.”
Structural Drivers Behind the Repricing
UBS highlights the importance of starting conditions. Silver prices had risen approximately 250 percent year over year prior to the correction. At the same time, traditional drivers of demand had already begun to weaken.
ETF inflows slowed, speculative positioning in China and US futures markets retreated, and silver prices in China traded at a growing premium relative to London and New York. Silver swap rates also turned positive, signaling increasingly concentrated demand.
“Silver prices in China began trading at a significant premium, while swap rates turning positive suggested demand was becoming narrowly concentrated.”
Role of Policy Expectations
The bank also notes that Warsh’s nomination reduced perceived tail risks related to Federal Reserve independence. In recent quarters, gold and silver had benefited from investor concern over political pressure on the Fed. While UBS expects consensus driven policy making to remain intact, the nomination eased extreme downside scenarios that previously supported precious metals positioning.
At the same time, debt sustainability concerns across major economies remain unresolved, which the bank believes will continue to support longer term interest in precious metals broadly.
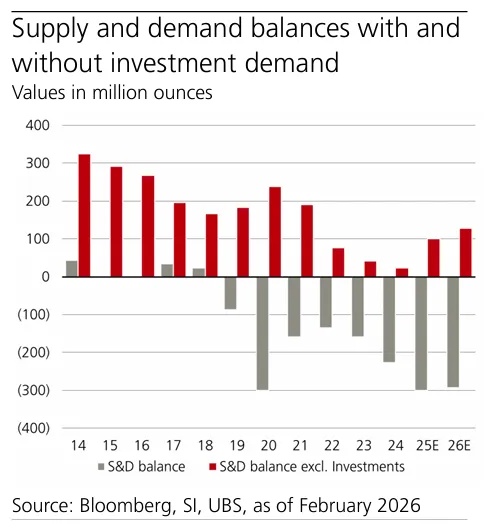
Demand Sensitivity and Industrial Constraints
Silver faces an additional complication due to its demand profile. More than half of silver demand is tied to industrial applications. UBS argues that even after the sharp correction, prices remain high enough to incentivize substitution, efficiency improvements, and reduced end user consumption over time.
The bank’s market deficit estimate of nearly 300 million ounces assumes investment demand exceeding 400 million ounces this year, a threshold that may prove challenging amid heightened volatility.
“With more than 50% of demand linked to industrial applications, current prices are likely to result in reduced industrial demand over time.”
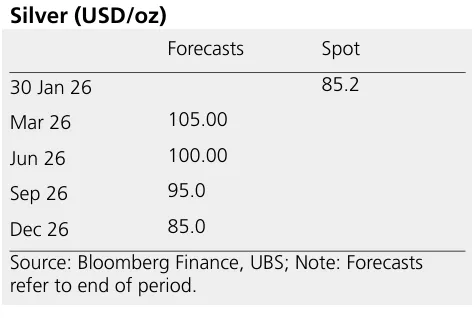
Investment Implications
UBS concludes that it is premature to build long term silver exposure at current levels. From a risk reward perspective, the bank believes further downside is needed to compensate for volatility now embedded in the market.
However, UBS continues to favor volatility based strategies, particularly selling downside price risk to capture elevated option premiums. These approaches are positioned as suitable only for investors with high risk tolerance and disciplined position sizing.
“We continue to favor selling silver’s downside price risks for yield pickup, given exceptionally high option volatility.”